The Research Page
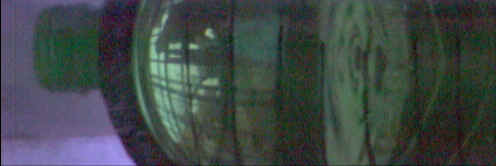
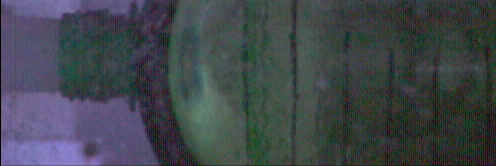
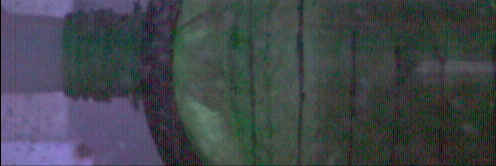
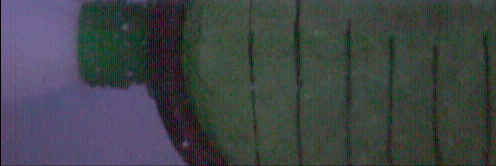
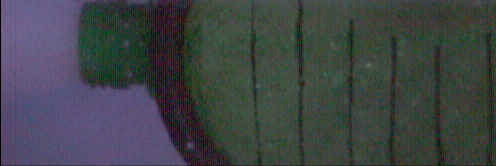
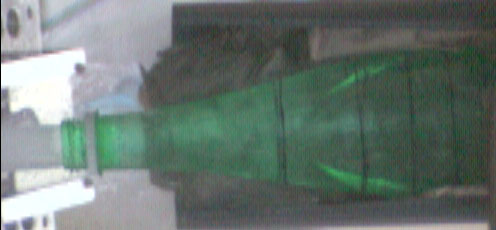
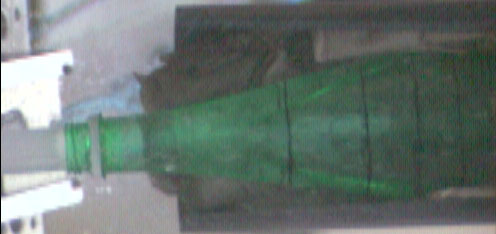
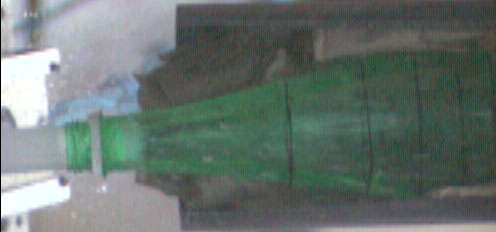
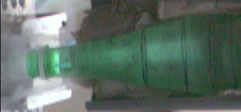
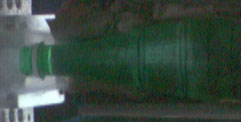
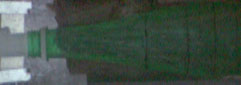
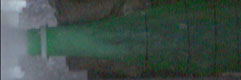
High speed video film of water rocket launches
2L 8b Filmed at 500 images /sec Leeds University.
1L 8b
![]()
![]()
![]()
![]()
![]()
Experiments and Research
From a strictly professional view point, there has been a considerable amount written about how water rockets work but little if no research data to substantiate them.
In general it would appear as though a large part of the available literature on the subject rests scientifically unproven.
Test repeatability and data to support conclusions are conspicuous by there absence.
Conclusion:
There is a real need to produce repeatable test data and eliminate some of the commonly accepted oversimplifications.
As an engineer very few of the literature/ computer models available appear to represent what we have recorded.
Consequently our research continues!
In search of the parameters that influence acceleration
During the power water jet phase the accelerations seen for both bluff Badoit and Coke bottle forms are none linear.
That beyond the Tsiolkovski point very high accelerations have been filmed. With in the case of the Badoit acceleration is in excess of 4300 m/s2.
These levels of acceleration are beyond the maximum of those expected by existing models and theory. WHY?
This is our quest to discover the reason behind the performance of certain water rockets.
General Relativity and rockets
Rate of change in mass ratio comparison..
Based on Arianespace A5
Flight data A167pdf![]()
Pressure and volume test curves 2005
Click on the tabs at the bottom of the Excel spreadsheet to see the curves
Click on this title for My analysis of the pressure curves at 8bar can be seen in the attached spreadsheet
A comparison of the different thrust force parameters used to model performance are compared Some of the standard approximations for thrust do not take into account either nozzle coefficient cf or variable fluid mass flow rates.
An introduction of specific impulse Ispec is encouraged to compare thrust efficiency using data taken from the pressure and volume curves.
Models for the fluid thrust produced when the reservoir is static and the modification required for both the nozzle design coefficient Cf and that for the dynamic case using the Tsiol parameter are compared.
The profile of the volume (m3) against time (s) curves indicate the rate of mass flow. So could be used to indicate the Design Point for the nozzle. Note however these are produced for a static nozzle/bottle
.
Comments by JG
Pressure was recorded at a 5000times /sec whilst fluid volume was recorded on film at 500 frames per second.
One of the principle objectives was to verify whether adiabatic or an isothermal model was more appropriate for modelling expansion process. As can be seen from the results this depends on the type of duct profile or bottle neck.
Different water volumes where used in the two types of bottle analysed
1L Badoit 320mls water
2L Coke 640mls water
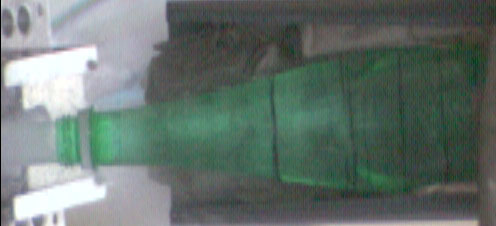
The bottles where held securely in a test frame.
Mass flow-rate of fluid from the Badoit bottle was higher than that produced from the Coke bottle. At 8bar there was a 27% mass flow-rate difference whilst at 4bar there was a 30% improvement in mass flowrate. Since Fth= qv where q is the mass flow-rate (Kg/s )and v the velocity of the jet (m/s). Then this brings into question the validity of using Fth= 2P*An .in our mathematical model. This expression needs to be modified to be more representative of the flow rate curve for the fluid flow through a certain duct/nozzle profile.
Mixed fluid phase in considered during the creation of the jet.
A simple conical duct model is adopted for the Badoit nozzle. Whilst a square step shoulder is used for the Coke duct.
Attempts at measuring the aerodynamic drag force for the different bottle types was limited by the maximum velocity of the wind tunnel used for the experiment.
The excellent pressure results are made available thanks to Dr.Johannes Knapp and Chris Holland.
Analysis of a water propelled rocket by Chris Holland 2005 pdf
Note: Temporary problem with pdf file Service will be resumed as quickly as possible
Examination of the volume curve produced from film images recorded at 500 images per second 0.002s. Indicates that there could possibly be a superimposed frequency of 1.5 cycles. B 50c/s C 20c/s Expansion compression cycle.
Comparing bottle types
Simple comparison of bottle emptying times without pressure. Demonstration of the 'appel d'air'. Low pressure above liquid volume induces a need for air to enter the bottle from the bottle outlet /neck to allow the liquid to leave the bottle. The opposing directions of the fluid flows sets up a fluid chugging oscillation within the bottle as bubbles of air enter the neck to allow the water to leave. The weak structure of the bottle buckles in and out as the pressure within the bottle reduces and is restored by the arrival of a new bubble of air.
-
This is a static test where forces introduced by the rocket accelerating upwards are not experiened.
-
The effect of a pressurised air volume is also removed.
This phenomena is similar to that found in static pressurised bottles (see below) when the air water interface breaches the nozzle (neck of the bottle) or the flow becomes choked. When a similar chugging oscillatiing fliud flow can be seen reflecting back into the bottle.
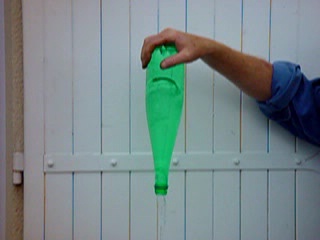
Badoit1litre completely filled with no air above liquid at start. 9.72 sec video
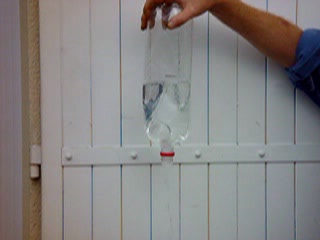
2L Coke filled with same 1liter water volume. Filled from Badoit volume.6.104sec video
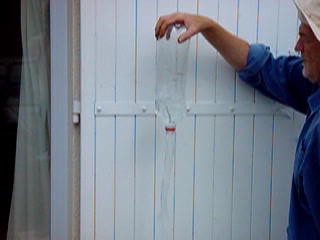
2L Coke filled with same 1liter water volume With swirl 5.32sec video
A vortex at the center of the fluid system can help the air pass through the liquid to the top of the inverted bottle and reduce chugging.
Dr Johannes Knapp
http://www.ast.leeds.ac.uk/~knapp/
Department of Physics and Astronomy, University of Leeds, Leeds LS2 9JT, UK
Students Martin Mansfield
A.Parkinson
Stuart Weston University Technician.
The effect of bottle design on water rocket performance

Bottle 'A' is a standard 2145ml Coke bottle. 8bar 500mls water, Launch images recorded to a height of 2.4m
Comparisons of the two different bottle types identified differences between the mathematical model predictions and the actual rocket performance.
Simple thrust force T = 2PAn
That is derived from the basic Bernoulli fluid flow equation.
Fluid flow dynamics
The Bernoulli flow equation compares the energy distribution within a fluid flow system. By generating fluid pressure equivalents for dynamic pressure 1/2rv2 due to the fluid flow velocity, potential pressure rgh due to the hydraulic head and static pressure P forcing the fluid flow.
![]()
http://scienceworld.wolfram.com/physics/BernoullisLaw.html
^ Click on image to load film 4.3Mb
The thermodynamic expansion assumes adiabatic expansion for an ideal gas are used for the model of the cycle.
P0.V0g = P.Vg .
Conventional height and velocity against time curves generated from the high speed film images produced some unexpected acceleration curves.
A clearly none linear acceleration characteristic was identified during the jet pulse event.
These experiments where repeated for a range of launch pressures ranging from 5 to 8 bar with 500mls of water.
The importance of efficient energy conversion during the first 0.1secs after launch is identified
Notes by John Gwynn:
Recognising the limited resource available on such a project means that some of the questions that are raised during the first phase of the project cannot be answered within the time available.
Below I have tried to identify some of my thoughts:
A full interface model of the projectile with its environment , the feedback forces involved and how they effect the overall projectile system efficiency .has not been achieved.
How these variable parameters affect both the external and internal fluid flow systems.
How the acceleration loads created during the initial jet phase effect, the nozzle efficiency, flight stability dynamics and changes in aerodynamic drag force.
Could well contribute to the nonlinear character of the acceleration values recorded during each jet phase.
Whilst the existing mathematical model predicted the performance of bottle 'A' fairly accurately at lower pressures. It fails to predict the none linear acceleration change in performance at higher launch pressures. Or identify the differences in initial jet impulse conversion efficiency seen with the two different bottle types.
The corresponding full flight data for the rocket after the initial launch phase could be used to quantify the overall flight performance, correlated to a specific high speed launch film.
The effect of different aerodynamic drag coefficients are recognised but not quantified. Due to the lack of time and resources available.
A good effort and a good base for the next research team..
.
A suivre ......
Compares the initial launch phase of two different types of bottle filmed at 500 images per second to a height of 2.4m.
Here the image sequence is run for bottle A and is made up by stringing together some of the images.
The background scale graduations are at100mm intervals.
Reference Leeds 2004 high speed films database.
Coke 8 bar dynamic launch film1 image stream, film2 image stream and static frame test 5b,6b, 7b
Badoit 8 bar dynamic and static frame image stream film3
Badoit and Coke 5bar, 6bar, 7bar. and 8 bar comparison.
Badoit 5,6,7 and 8 bar gif fixed bottle with 500mls. Plus 8b flight.
Coke 5,6,7, and 8 bar gif for fixed bottle with 500mls Plus 8b flight.
Extracts from these are featured below.
Rocket launch of bottle 'A' 2145ml


Notes: by John Gwynn
April 2004.
Note: Film Image frame numbers descend with time
C7bar Frame181 Plug removed and jet stream released.
C7bar Frame177 Parallel jet stream. Liquid surface deformed by fluid displacement and bottle vibration.
C7bar Frame169 Parallel water jet stream with exterior water level just above first black ring.
C7bar Frame168 Coaxial air pocket enters nozzle. Whilst external liquid is left near the wall of the bottle forming a liquid funnel for the air to pass at its center

C7bar Frame165 Start of mixed fluid air -water jet stream
C7bar Frame181Start of parallel water jet.
Tjet = 0
0.002s / image frame
C7bar Frame168 Coaxial air pocket is about to break nozzle.
Tjet = 13 frames > 0.026s
C7bar Frame167 Start of mixed fluid jet 'White Out'.
Tjet = 14 frames > 0.028s
C7bar Frame 146 Final Purge of mixed fluid white jet stream.
Tjet = 35 frames > 0.07s
C7bar Frame 145. Angle of jet at nozzle outlet reduced.
Tjet = 36 frames > 0.072s
Coke 8 bar Static Test
C8b 1 163 Plug removed Tjet = 0

C8b 160 Parallel jet stream Tjet = 0.06s

C8b 152 Tjet = 0.022s
C8b 2 151 Start of mixed fluid white plume Tjet = 0.024s

C8b 150 Tjet = 0.026s

C8b 3 104 End of white plume Tjet = 0.112s

Bottle 'B' is a standard 1000ml Badoit bottle. 8bar 500mls water Launch images recorded to a height of 2.4m.
Click on image to load film 4.7Mb
Rocket launch of bottle 'B' 1000ml


Notes: by John Gwynn
April 2004.
Static B7barFrame 314 Parabola of air pocket indent reaches second black ring.
Static B7barFrame 312 Stretched parabola of air pocket approaches first ring.
Static B7barFrame 310 Air pocket forms point and heads for the nozzle outlet.
Static B7barFrame 308 Coaxial air pocket is about to breach the nozzle outlet.
Tjet = 0
0.002s / image frame
B7bar Static Frame317 Start of parallel water jet stream
Tjet = 0.002
B7bar Static Frame308 coaxial air stream reaches nozzle.
Tjet = 10 frames > 0.02s
B7bar Static Frame 307 Start of mixed fluid jet 'white out transition'.
Tjet = 11 frames > 0.022s
B7bar Static Frame258 End of mixed fluid jet 'white out'
Water spill with unknown mass flowrate.
Tjet = 60 frames > 0.120s
Jet Sequence at 8bar
B8b 1 Start
B8 bar Static Frame 264 Plug release with deflected spray cone
Tjet = 0s
B8 bar Static Frame 262 Parallel water jet
Tjet = 0.004s
B8 bar Static Frame 253 Compressed air pocket approaches the nozzle outlet ( Just to the right of the white ring)
Boundary layer of liquid left at the interior wall as air pocket passes at its center.Jet stream parallel Tjet = 0.022s

B8b 2
B8 bar Static Frame 252 Mixed fluid jet stream 'White transition'.
Tjet = 0.024s
B8 bar Static Frame 251 There appears to be some white froth inside the neck of the nozzle. Possibly a reflected shock wave?
Increase in the cone angle of jet stream leaving the nozzle
Tjet = 0.026s

B8b 3 Tjet = 0.112s
Earliest
B8b Static Frame208

B8b Static Frame206 Jet cone begins to break up at edges and oscillate from side to side.

B8b Static Frame202 Tjet = 0.124s

B8 bar Static Frame 200 Reduction in the white intensity of jet stream.
Cone angle of jet stream increases to
Latest.
Tjet = 0.128s

B8 bar Static Frame 195
Tjet = 0.138s
A comparison between the static and dynamic launch tests carried out at a pressure of 8bar and 500mls water for the two projectiles/bottles indicates that:
1.The onset of the white mixed fluid plume occurs earlier in the static test than is seen in the dynamic launch.
StatTjet 2 = 0,75 * DynamicTjet2
2. That the duration of the mixed fluid plume continues longer during the static test than is seen with the dynamic launch.
By a factor of 2.8 > 3.
Although the exact termination is difficult to determine an event window of earliest and latest has been adopted.
Measurement of the mass flow, the white intensity and opaque nature of plume combined with the stability/ fluctuation of the jet output cone angle can be used to indicate more precisely this end point.
StatTjet 3 = 2,8 * DynamicTjet3
3.There is possibly a common relationship between the static and dynamic trial results for the two different bottle types.
Experimental apparatus for the static frame tests needs to be improved to eliminate any bottle movement during the experiment.
It can also be seen from the films that the longitudinal axis of the test bottles is not controlled vertically.
Sychronised pressure / time histories could be recorded and thrust force measured.
Abstract :
Observation based on results taken at LU 2003
For the dynamic launched rocket case :
The mixed white fluid plume starts later and has a shorter duration than the static frame test fluid jet
from the same bottle. Using the same water volume and air charge pressure.
Note: Based on the above research data gives the following approximations:
The mixed white fluid plume for the dynamic case starts later (1.33* StatTjet 3) and has a shorter duration than the static frame test fluid jet from the same bottle.( 0.357* StatTjet 3)
-
From this comparison we could assume that the mixed fluid flow phase occurs later in the dynamic flight nozzle.
Click for Excel Table Comparison of static and dynamic tests at 8bar.
Photographs and images contained in the report are displayed with the kind permission of Dr. J..Knapp
Department of Physics and Astronomy, University of Leeds, Leeds LS2 9JT, UK.
Indentified physical dissimilarities :
-
Body length. L mm
Rocket A = 336 mm
Rocket B = 320 mm
-
Bottle cross sectional diameter.
B
A D1= 98mmB
B D2= 80mm.-
Bottle volume
Vol A 2145mls
Vol B 1000mls
Note : That both bottles are unstable in flight due to the centre of mass being lower than the aerodynamic center. So there is no stabilising moment to govern the true vertical trajectory desired by the experiment.
The effect of this can be seen in the launch photographs.

A comparison of the centers of mass (top) and of aerodynamic cd (Black point in middle is the center of inertia of an exact profile card cutout). Shows that the aerodynamic center is above the center of mass.
Indicating that it needs to be lowered by approximately90mm.
Consequently as a projectile the bottle will be unstable and veer away from the intended vertical flight path..
In addition to which they are both effectively blunt nose projectiles. Due to no nose cones being added.
Bottle A has a hemispherical form and bottle B an indented flat profile.
Rocket launch of bottle 'A' 2145mls
Scaling image for the 2Lcoke bottle recorded at 500 images per second. For launch at 8bar
Mixed fluid spray plume approximate length L
plume = 32.3 cm100mm =13mm Scale factor 100/13= 7.6923
For image size 42mm scaled equivalent 323mm.
Number of visible pulse ripples contained in the white plume wake 10.
Rocket launch of bottle 'B' 1000mls.
Notes by John Gwynn:
Objective: To understand why some of our Badoit rockets fly better than predicted by existing
mathematical models.
Comparison with some of the standard formula helps to focus on relevant parameters.
Systematically regarding each term and asking the question are they constant during the water jet impulse.
Where (
mf ) is mass flow rate leaving the nozzle in Kgs/secV
1 Is the jet stream velocity m/sPe Is the pressure of the fluid stream as it leaves the nozzle N/m2
Pa Is the atmospheric pressure outside the nozzle into which the jet stream passes. N/m2
Se Nozzle matching parameter.
Note : V2 Is the actual velocity of the rocket m/s
Due to the ‘Tsiolkovski’ factor V2 can be greater than V1. Looking at the formula for determining the jet thrust force that propels the rocket.
Initially we can say that Fjet is directly proportional to the value of V1
Looking at Graph 2 for bottle B 1 liter.
What I would expect to see is some form of ‘Tsiolkovski’ affect during the water jet phase. In a jet system which is approaching a high fluid flow efficiency system.
This would be influenced by being able to identify the Tsiolkovski break point.
And also the rate at which this point is reached.
So we would need to identify some appropriate parameter like
mf / Ts linked to a performance parameter like specific impulse. Fth/ (g* mf).Where:
Mf = Mean fluid mass flow Kg/sec
Ideally we should be able to identify the actual mass flow at any point in time. During the fluid jet phase.
Ts = Time to reach the Tsiolkovski point sec.
Subsequent to this point we should be able to define the final phase of the mass flowrate.
And whether there is a stable fliud flow system or not.
The shape of these graphs could be explained if we can identify the Tsiolkovski break point for each curve.
So breaking the curve into two distinct phases. Before and after.
This I define as the point on the curve where the mass ratio M1/ Mn = 2.71828.
So beyond this point the LogN ( M1/Mn) term will be greater than one for any remaining fluid mass and V2 becomes >V1
Whilst before this point the fluid mass left in the bottle would effectively have a decelerating effect.
If we accept that the curves are sufficiently accurate to indicate a trend. Then we can look at the relative positions on the curves at which Ts occurs and compare the values of mf / Ts for each pressure.
As would be expected as the launch pressure increases the Ts point moves towards the origin.
For values of
mf / Ts < 140 the gradient of the tail of the graph is negative ( Falls away) for both bottle types.This we see exhibited at lower launch pressures
For bottle A the values of mf / Ts at the threshold point would appear to be lower at all pressures relative to the equivalent values found for bottle B .
At a pressure of 5bar the value of mf / Ts at which the graphs fall away after the threshold point are :
Threshold A mf / Ts < 120
Threshold B mf / Ts < 140
If we assume that the Tsiolkovski mass effect becomes significant above specific values of
mf / Ts for a specific projectile form Cd , nozzle design effy and mass. Then we might well have something interesting.The characteristic curve shape will be defined by the change in rate of mass flow of the fluid jet and the resulting external aerodynamic drag.
Possibly we have identified the conditions when the mass effect becomes predominant
The initial dip in the acceleration / time curve is due to the initial value of mass flow mf being reduced due to the close fitting internal launch tube effectively blocking the nozzle . Causing the gas to expand and initially lift the rocket above the tube. Subsequently releasing the water jet thrust force.
So what are the possible causes for this effect of varying acceleration during the jet phase:
The principle candidates are
1.Change in mf mass flowrate leaving the rocket.
Where (mf ) is mass flow rate leaving the nozzle in Kgs/sec
V1 Is the jet stream velocity m/s
Pe Is the pressure of the fluid stream as it leaves the nozzle N/m2
Pa Is the atmospheric pressure outside the nozzle into which the jet stream passes. N/m2
Se Nozzle matching parameter.
Note : V2 Is the actual velocity of the rocket m/s
Due to the ‘Tsiolkovski’ factor V2 can be greater than V1. Looking at the formula for determining the jet thrust force that propels the rocket.
Initially we can say that Fjet is directly proportional to the value of V1.
Linked to Tsiolkovski’s formula.
V2= V1 * LN M1/M2
2. A modification of this formula.
Adapted to higher accelerations over a short period of time.
3.Nozzle design efficiency at varying fluid flow rates and accelerations.
Variations in the fluid properties at high energy transfer rates.
Marking the difference between quasi static flow and dynamic flow characteristics.
Similar to that found with the performance of materials subject to either a slow loaded deflection or a high energy impact/impulse.
For bottle B The rate of change in volume can be defined by simple cone analogy dV/dx= p( r2/ i2).x2
Where x is the vertical displacement of the fluid surface along the axis of the convergent nozzle/bottle neck.
The term dV/dx can also be expressed as dV/dx = p *(Tanf.)2.x2
Where 2f is the included angle of a cone generated by rotating a line of gradient about the x axis. That represents the convergent nozzle.
However for a curved duct like bottle A its a little more difficult .

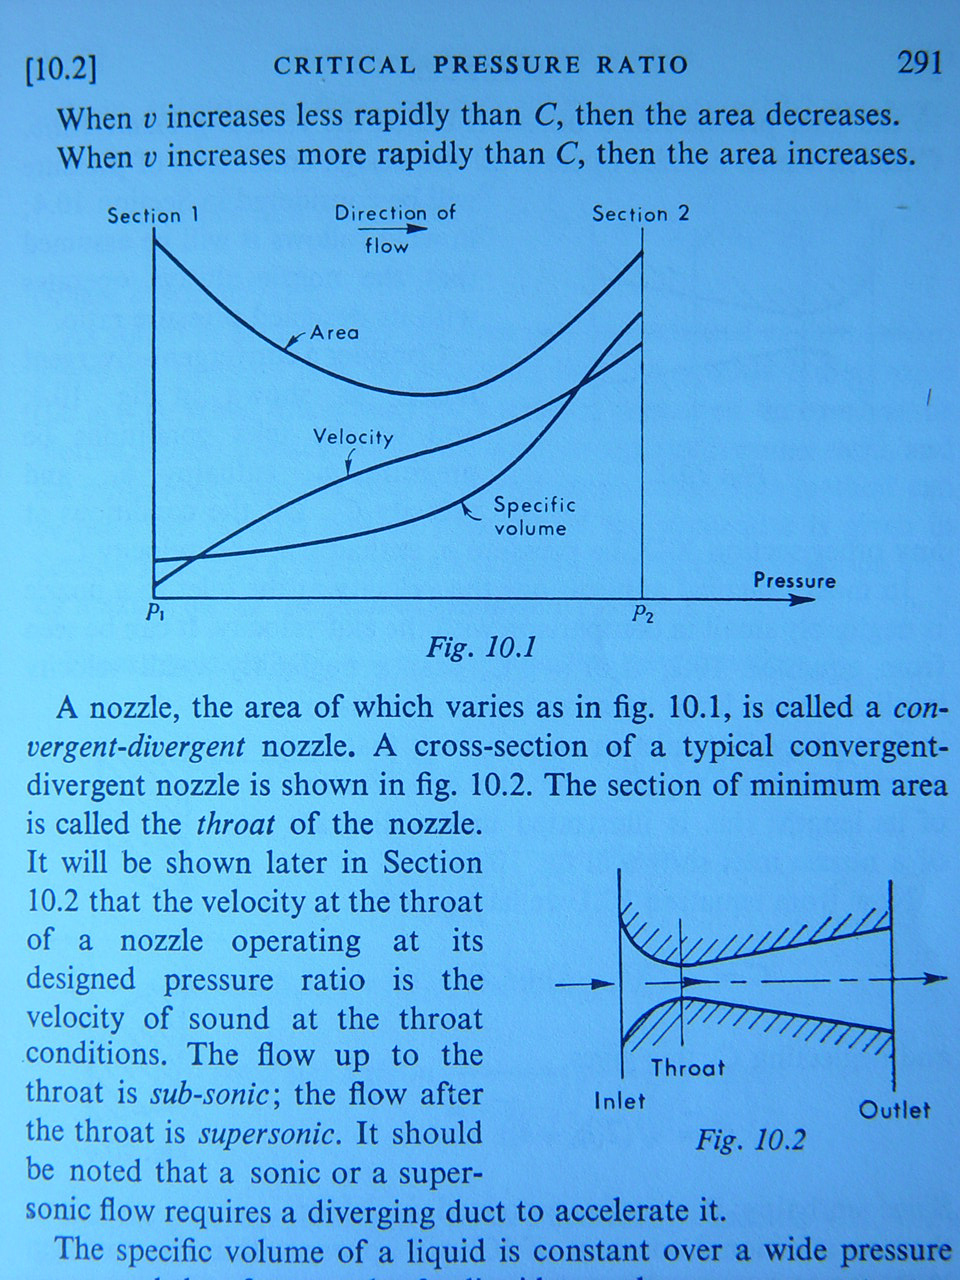
Operation at the convergent nozzle design point.
The physical form of the bottle neck can be taken to be the profile of a convergent nozzle.
Optimum mass flow of fluid is achieved when the pressure in the fluid at the nozzle has expanded down to the design pressure. For there to be optimum mass flow on leaving the nozzle then the design pressure needs to be matched to the atmosphere into which the flow is released. So for example the pressure outside the nozzle needs to be the same as the design pressure of the nozzle. This pressure into which the nozzle discharges is referred to as the Back Pressure .
Under expansion
If the back pressure Pb is below the design pressure Pc the nozzle is said to be 'under expanded'.
In the case of an under expanded convergent nozzle the fluid flow expands down to the design pressure in the nozzle. An then expands violently and irreversibly down to the lower discharge or ambient ( back pressure).This is usually achieved by a series of alternating compression and expansion shock waves until the ambient back pressure is reached
A good example of this can be seen in the 8b Coke bottle launch image where a sequence of 10 shock waves can be identified in the mixed fluid plume.
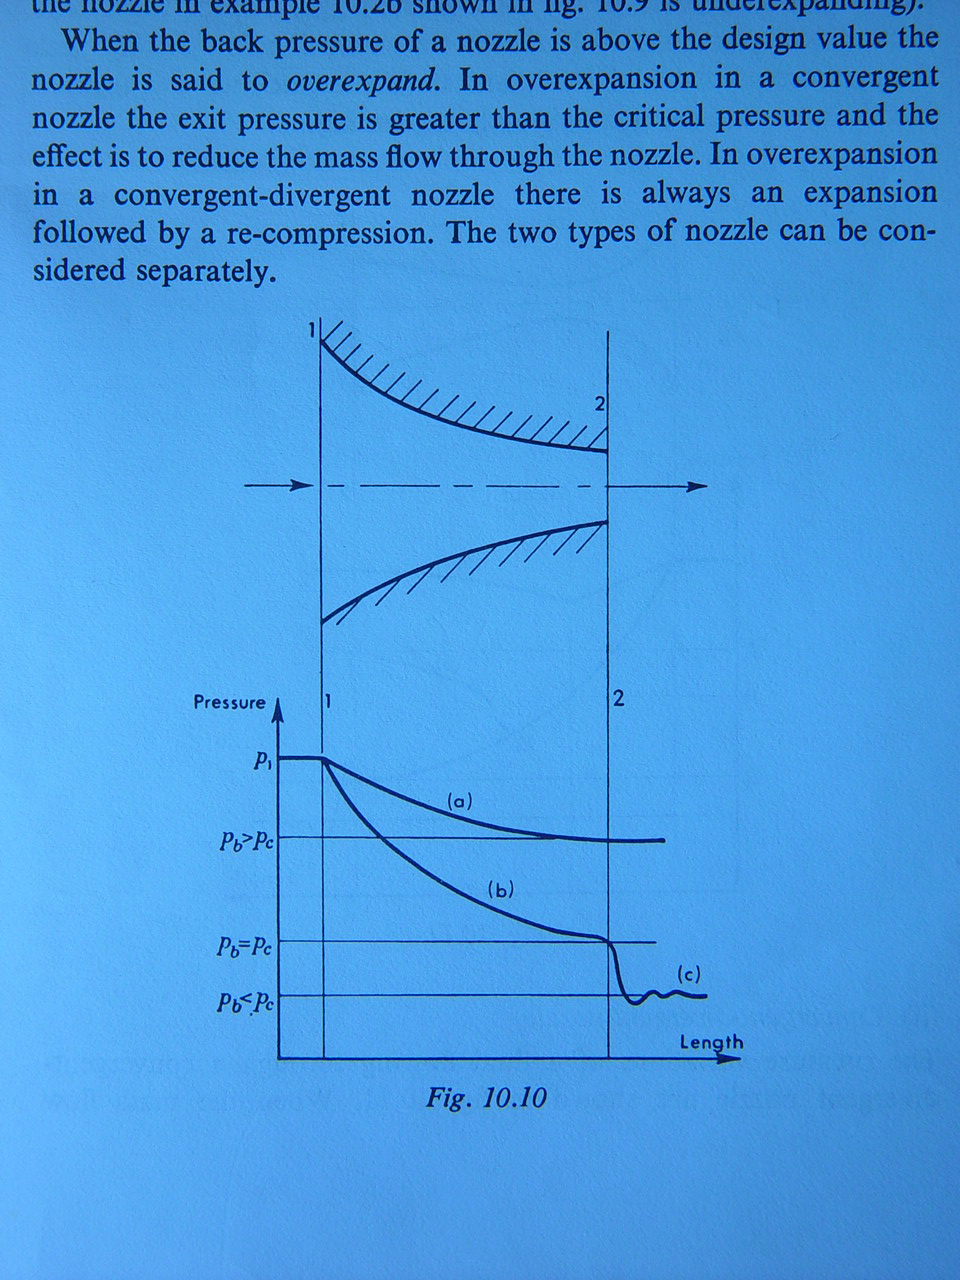
Over expansion.
This occurs when the design pressure Pc is lower than the back pressure Pb.
For a convergent nozzle having a back pressure higher than the critical pressure for the nozzle means that the flowrate through the nozzle is reduced.
Note: This is why a convergent divergent nozzle is useful in that it allows the fluid flow to re
compress in a more controlled process to approach and match the higher back pressure. into which it
enters.
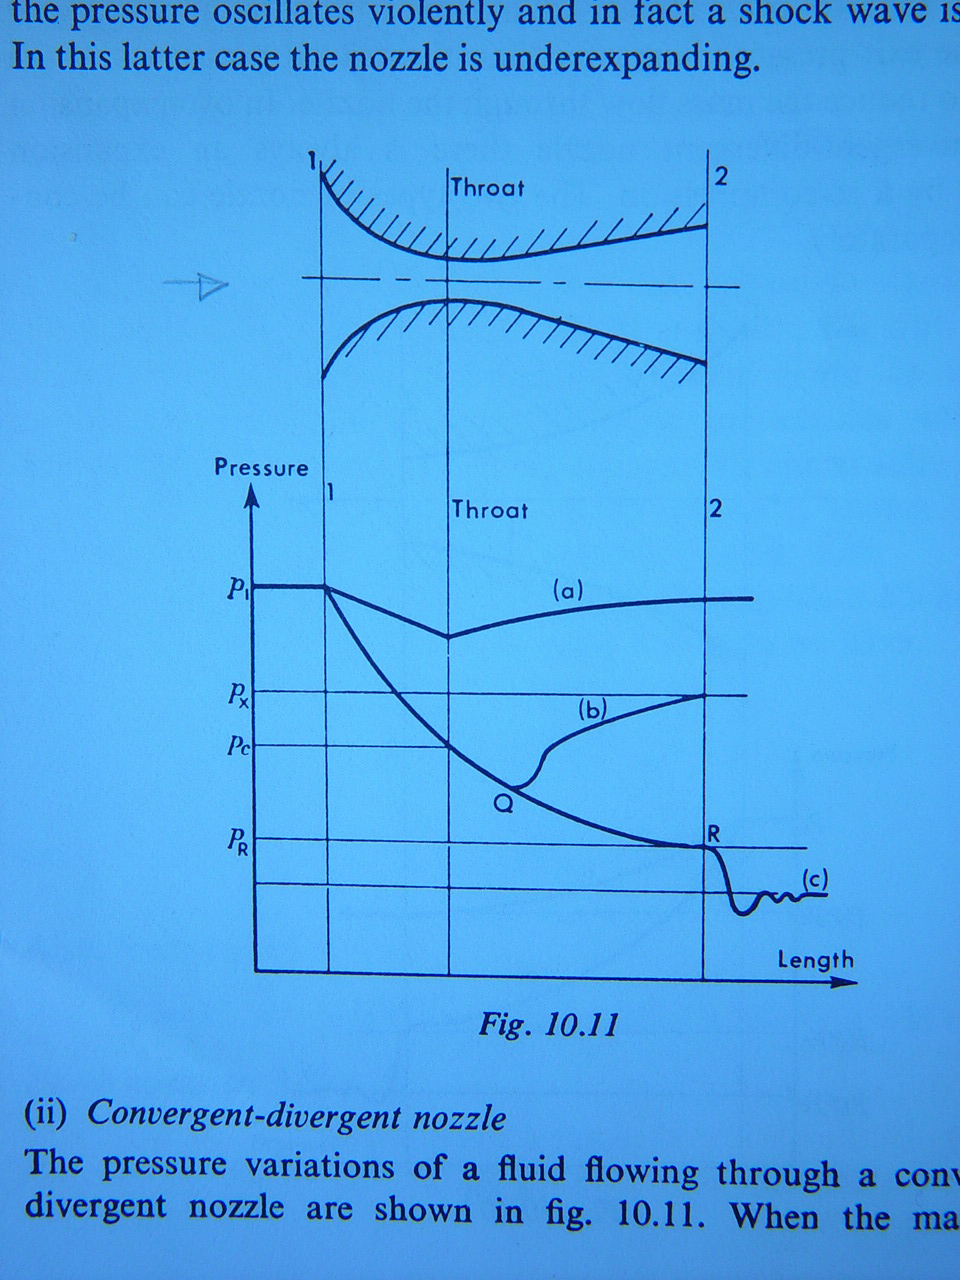
Curves a and b are both both cases of fluid flow experiencing overexpansion within the nozzle.
Curve a shows the case were the mass flow of fluid through the nozzle is very low and subsequently the pressure achieved at the nozzle throat is well above the critical design pressure.
Taking a specific case where the design pressure Pc is below the back pressure Px. Then the flow in the nozzle initially expands down from the initial pressure P1 to point Q and then undergoes a violent re-compression along b to return to the background pressure.
In the case of end curve c the back pressure is lower than the design pressure PR. So the fluid flow has to expand down to the background pressure. This is achieved by a series of violent alternating irreversible expansion and compression shock waves until the background pressure is reached.
Why irreversible?
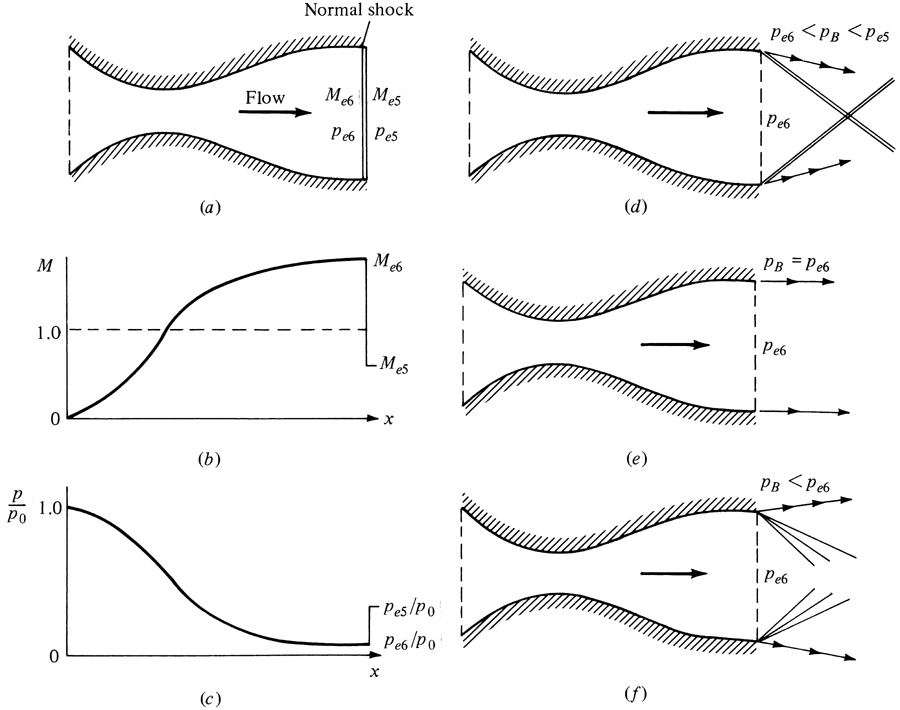
In this illustration from Anderson Fundemental Aerodynamics
Pe6 is the Exhausts pressure.
PB is the boundary or back pressure into which the exhaust jet is released. on leaving the nozzle
If our objective is to maximise the mass flow passing through a nozzle. These characteristics need to be identified for both the quasi static flow condition and for the nozzle and fluid system exposed to high accelerations.
Simply this means that for each duct profile there is a design point (or critical pressure) at which optimum mass flow can be achieved. Either side of this point and flowrate will be either reduced or worse still become violently unstable.
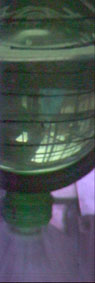
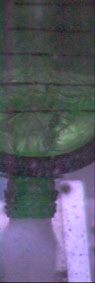
Note: A series of static nozzle tests have been filmed with the high speed camera. To permit analysis of the fluid nozzle flow for the different bottles over the same range of pressures.
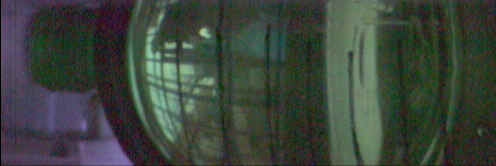
Indicating that there is both a progressive penetration of the air volume along the central axis of the fluid stream as the fluid level descends and reflected fluid from the shoulder of the bottle near the end of the fluid purge cycle. Some of the selected images from these films will be put on the site.
The bell shaped intrusion at the air /water interface probably indicates the distribution of fluid shear flow from the center towards the pressure vessel wall .
Because of the difference in jet events times recorded for the static and dynamic trials at the same test pressure. It is currently not possible to confirm whether the air pocket breaches the water volume contained in the base of the rocket during dynamic trials in a similar way to that recorded for the static tests.
It is thought that the high acceleration loads just after launch and during water jet spike phase could radically alter both the thickness of the liquid boundary layer and the form of the profile retained at the interior walls of the duct.
Dec 2002 Initial test flight of the heavy lift Ariane 5 ECA
Vulcan 2 nozzle failed at altitude due to low atmospheric pressure outside the nozzle causing the bell shaped expansion nozzle to deform. The resulting reduced thrust and localised heat transfer problems triggered the abortion of the inaugural flight.
Inadequate development testing was identified as one of the principle causes for this flight failure.
Improved cooling and stiffening of the nozzle that was then proved during numerous static engine test fiirngs resolved the problem.
Analogy with a step pressure impulse to the system ht producing a variably damped response function of the type
( 1/C )* e - Kt/C.
C y’ + Ky = x
Where C is proportional to the dynnamic and kinematic viscous properties of the fluid.
K is proportional to the gas spring pressure or system stiffness.
For rocket ‘B’ I have identified a good match for the damping coefficient using LN t/fth
Where the rate of change of volume is represented by the form of the nozzle shape
dV/dx = p*(r2/ i 2)*x2 is assumed to be directly related to fth the thrust force
and t is the elapsed jet time in seconds
This matches the final positive gradient of the curve.
For the 8bar curve for rocket B there is what looks like either an error or a super imposed damping function of the order of 25c/s .
5.Aerodynamic drag resistance parameters.
Due to the high acceleration levels to which the blunt bottles are exposed during launch.
Surface air shear flow, aerodynamic resistance / drag force and dynamic flight behaviour could change significantly for the different launch pressures.
If the rocket is dynamically unstable after launch this can increase the proportion of the energy absorbed by air resistance.
Effectively retarding the rockets upward acceleration.
The effect of different nose cone shapes see Aerodynamics section.
Fd= 0,5(de)(Cd)A(V2+Vair) 2
If this is applied to A and B the Fd or air drag force ratio is
Csa A/ Csa B = 1.5
The comparative values of Cd are not defined.
That there is a sudden change could indicate that a certain external flow regime has changed.
Where ever there are shock waves seen in the exhaust jet plume then there is likely to be an equivalent pulsing surge on the air flow passing over the form of the projectile. This could make the external air flow unstable and generate boundary layer separation.( and increased drag)
6. Natural acoustic frequencies of the pressure vessel
Several natural frequency modes exist :
-
Longitudinal or organ pipe chugging
-
Tranverse tangential or spinning.
-
Tangential 1st harmonic or Sloshing.
-
Tangential radial fundamental or radial pulsating.
-
Where ever there are shock waves leaving the nozzle then there is likely to be a reflected shock wave that returns inside the pressure vessel/bottle.
7. Compressed air volume/capacity and its effect on jet thrust and the thermodynamic
cycle.
-
The mixed fluid phase.
-
Water jet phase.
-
Air jet burst.
-
Convergent duct design efficiency for the three phases.
8. A combination of the above.
9. Experimental error. In recording the height and velocity time histories.
Repeatability
Test Sample size.
Any small errors in height measurement will be amplified when the velocity and acceleration
figures are calculated from the same data.
10. Gravitational field effect
The lateral thinking zone...
This is a what if hypothesis
What if we imagine that a form of gravitational field is created at high accelerations per unit mass.
Then at certain conditions we could imagine that the type gravitational field created ( similar in nature to that of electromagnetic field ) around the accelerated mass could deform. If so then we could also imagine it would be possible to pass through an equivalent to a gravitational sound barrier as the created gravitational field deforms around the moving mass. And the acceleration /mass ratio reaches a critical value
This would apply to ultra lightweight particles or projectiles that have high acceleration to mass ratio and experience high orders of acceleration .
So we have an equivalent to the Mach effect where the boundary layer deforms as the projectile approaches the critical velocity of sound. But in our case it is gravitational field flow and the critical point is Tsilokovski point .
f we imagined that a vertcally accelerating mass under extreme conditions, was capable of creating its own gravitational field then time would be altered relative to a static observer.
We would find a relationship after the Tsiolkovski point for the end of the impulse as derived below.
The derivation would also help explain the exponential change in acceleration seen in the 8bar curve for the Badoit after the Tsiol point
We could also say that the effective mass is modified by the degree to which it is accelerated.
Up to the limit when LN M1/M2 = 1
the limits of integration are respected but after this point we need to find another end function.
Because the limits of u <<< v
and dM <<< M
.are no longer true. So eliminating u and dM by saying that they tend to 0 u = 0 and dM = 0 is also no longer acceptable.
Where u is the velocity of the light projectile relative to a stationary observer
v is the velocity of the the exhaust jet stream relative to the same stationary observer.
dM is the incremental loss of fuel or in our case water mass from the projectile over elemental time dt.
and M the mass of the rocket or projectile
So u tends to v
Effective Mass Meff = m g/Acceleration in g
Or gravitation effect = 1/Acceleration in g
Another way of trying to understand what could be happening is to try and imagine that for a fraction of a second the projectile experiences a form of micro gravity.
Standard Tsiolkovski Derivation.![]()
Modified Tsiolkovski derivation for the end
impulse based on experimental results![]()
Excel spreadsheet with worked example of end function modification based on high speed film imagery. Impulse end functionExcel
For the parameter
![]() with
dimensions
with
dimensions ![]()
The factors which could alter its value are:
An increase in the value M1/M2 that we already use in the Tsiolkovski formula.
An increase in the ratio a2/a1
An increase in the relative time ratio T1/T2
John Gwynn
Understanding the gravitational attraction force between two masses.
Do we know what creates the weak gravitational force used by Newton in his gravitational mechanics formula and accepted up to present.? In short. No we don't.
We have all the formula but we don't know how the weak gravitational force is created.
Does gravity exist in wave form and travel at the speed of light ?
Understanding the weak gravitational force between two masses 1N = 105 dynes (cm/s2)
http://www.fourmilab.ch/gravitation/
http://www.fourmilab.ch/gravitation/foobar/
Einstein's General theory of relativity 1915
Following Einstein's earlier theory on time and space entitled Special Relativity in1905. His theory on General Relativity in 1915 was a logical development concerning the equivalence of gravity and acceleration . That states that neither time or distance can be given absolute values but vary according to the state or time frame from which they are observed.
In general relativity both time and space can be altered by the gravity and motion of a mass.
The equivalence of gravity and acceleration
Gravity pulling in one direction on any mass is balanced by the same mass sensing an acceleration in the opposite direction.
Here are two examples
-
Vertical acceleration in a lift produces an equivalent downwards acceleration on the people in the lift sensing they are increasing in mass. As they sense through there body that there mass is being pressed against the floor of the lift.
-
A driver accelerating away from a standing start in a sports car will experience a sensation of his own mass being pressed hard against the back of his seat.
Changes in a local gravitational field will affect local time relative to a static observer.
http://www.pbs.org/wgbh/nova/einstein/relativity/
Now taking the example of our water rocket accelerating vertically upwards, like the example in the lift , the water in the bottle will think it's mass has increased in direct proportion to the upwards acceleration of the rocket.
This will be equivalent to an increase in the local gravitational field affecting the rocket. Locally the magnitude and direction of the acceleration affecting the mass being equivalent and opposite to the upwards acceleration. Pulling downwards in direct relation with the magnitude at which the rocket is accelerated upwards.
Relativity What is it?
http://nobelprize.org/physics/educational/relativity/index.html
Inertial frames of reference. What are they?
http://nobelprize.org/physics/educational/relativity/postulates-2.html
Investigation
into the Relative Time fields with respect to Tsiolkovski mass
transfer
![]()
Just in case you think this is a bit far fetched
March 2006
Gravitational field effect generated by moving mass discovered.
A 'Gravitational field effect' of a rotational mass has been discovered, by researchers financed by the esa, and could help explain the difference with that predicted by quatum physics.
Although only 1*10-8 times the value of g (9.81m/s2) this makes it 1*1024 larger than the value predicted by quatum theory.
Here an isolated super conductor loop is spun and accelerated at 1000 to 1500 Rads/s2 producing a gravitational field that opposes the direction rotation and effectively increases the mass of the super conducting coil.
There is a gravitational field created whilst accelerating and decelerating the super conducting coil mass in a direction opposing that of the acceleration.
This occurs when a Niobium superconductor (with a radius of 72mm) is accelerated at 21g.

http://www.esa.int/esaCP/SEM0L6OVGJE_index_0.html
pdf Experiment into the detection of Gravitomagnetic field March 2006
Video of interview with Dr Martin Tajmar STAIF 2006
http://video.google.com/videoplay?docid=8222045907997981867
Dr. Martin Tajmar is a research scientist and project manager in the Space Propulsion group at ARC Seibersdorf research, Austria's largest research institution, STAIF 2006 interview to discuss a variety of topics, including gravito-magnetic fields in superconductors & applications for advanced propulsion...
http://ilfb.tuwien.ac.at/~tajmar/
http://ilfb.tuwien.ac.at/~tajmar/ASPS_transparencies_03.![]()
Earlier paper by Tajmar and de Matos comparing Maxwell electromagnetic wave formula and there possible similarity with gravity waves.
http://www.arxiv.org/ftp/gr-qc/papers/0003/0003011.![]()
2002 Paper by Y. Chiao Berkley University On superconductor gravitational effects.
http://arxiv.org/PS_cache/gr-qc/pdf/0204/0204012.![]()
Looking for proof of the weak force gravity waves in space

LISA esa satellite group to be launched in 2015 to detect gravitational waves in space
This research is not to be confused with that of Eugene Podkletnov
1992 Original controversial research by Russian Eugene Podkletnov at Tampere University in Finland that claimed a possible 0.3 to 2% reduction in mass seen in materials placed above a static or rotating superconductor. Which he claims produce some type of gravitational shielding effect above a TypeII YBCO superconductor spun at 5000rpm.
Although possesing a docterate in materials science specialising in the production of superconductors.
The credibility of his results produced at Tampere University as a superconductor materials engineer are challenged because of him not being a pure research physicist and the inability of others to reproduce his experiments. Both factors have combined to create his lack of credibility within the scientific community.
As a direct consequence of an article published in the 'Daily Telegraph' in 1992 prior to the actual publication of his results in a scientific journal he lost his post at his Finish University.
Here is a copy of his original paper that was withdrawn after the publication of the article in 'The Daily Telegraph.'
http://arxiv.org/PS_cache/cond-mat/pdf/9701/9701074.pdf
Timeline in gravity related research
The order of acceleration seen with a Badoit nozzle is 450 to 500g.
Accepting that gravity is a very weak force and that the findings by Tajmar are 1*10-8g when the superconductor is accelerated at 21g.
These changes are seen as the super conductor ring is accelerated and deccelerated.
Could a changing gravitomagnetic field affect :
-
The Molecular linking within The fluid dynamics of boundary layers. Affecting the properties of external and Internal fluid boundary layers.
-
The effective local mass of a light projectile. Changing the Mass time relationship.
-
Help explain the Gallileo gravity equivalence of two different, free falling masses contacting the ground at the same time. When dropped from the tower of Pisa.
-
Gravitational field reversal between accelerating and free fall states.
With this in mind it is possible that at a certain level of projectile acceleration the local mass of the rocket plus water increases due to a locally increased gravitational field from which it is then released as retardation starts and the acceleration reduces at the end of the water spike returning back to gearth.
A sort of local gravitational sling shot or cannon. As the mass first increases as the gravitational field increases and then reduces as the local gravitational field reverses due to deceleration and then returns to normal gearth . A sort of local gravitational elastic membrane which at first holds the projectile back and then catapults it upward.
Try and imagine two elongated cones aligned on the same axis with there tips facing each other. The lower cone represents the local gravitational field increase (becoming more concentrated) whilst the upper represents the decrease. in the local gravitational field. If this where true then local time would also alter.
Is this the cause of the dip , point of inflexion ( at the Tsiol Point) and then an exponential increase in gradient in the acceleration curve.
In search of the parameters that influence acceleration
Indentification of several parameters
following analysis of high speed launch film 2004.![]()
Acceleration related derivatives.
The event of the jet impulse is defined by a time window which has a start and a finish. During this period a fluid is discharged vertically through a reduction nozzle to create a reactive jet.
The forcing system is the energy introduced by a compressed gas above the working fluid. And the potential energy of the fluid level in the reservoir. Once the projectile is airborne then a six degree of freedom flight model for the rocket determines additional inputs to the inertial mass and the fluid flow dynamics.
The density of the fluid being discharged during the impulse could change due to the presence of a mixed working fluid.
Based on high speed film of basic bluff projectile launches recorded at 500 images /sec
We can say that for a specific type of elongated conical nozzle there is an overall dynamic model which involves both internal and external fluid flow regimes.
That the acceleration during the power water jet phase is not linear with time.
That the acceleration of the rocket during the initial impulse phase is related to
If y represents acceleration then
y = e![]() 1
1
y = e![]()
Where
![]() is
the elapsed time during the jet impulse.
is
the elapsed time during the jet impulse.
is the rate of change of volume related to the displacement along an axis of the volume of rotation created by profile curve of the nozzle entry.
For the Badoit duct I have approximated this to
dV/dx = p*(r2/ i 2)*x2
by using a pure conical volume of the same angle.
![]() =
= 
Where r is the cone radius at the water level
I is the height of the water cone
r/I is the gradient of the surface of the cone about the 'x' axis
x the water level displacement
Which produces the same family of end curve beyond the Tsiolkovski point as seen in the acceleration time curve recorded at 8bar.
An alternative form would be to use the change in mass :
Related by the density of the fluid in the jet
r = M/VV = M/r
So we could express the rate of change of volume in terms of mass flow. By simply substituting the rate of mass change divided by the density of the working fluid.
![]() =
= ![]() =
=
![]()
y
= eHere M is the rate of change of mass/density ratio
John Gwynn All Rights Reserved April 2004
The Water Rocket ExplorerOroginal Excel spreadsheet whilst looking for parameters that could match the acceleration curve after TSIOL POINT
Next acceleration related parameter to appear that produces a similar curve to the acceleration time curve produced is
y =
e ![]() 3
3
![]() is
the elapsed time during the jet impulse.
is
the elapsed time during the jet impulse.
![]()
e![]()
e ![]()
e![]()
OK this is where things start to get interesting
All three can be related to the Specific impulse
parameter, since they can be directly linked to the rate of change in mass flow
and impulse time duration.![]() it
it
Specific Impulse Isp= F/ g.m* Sec Dimensional analysis Isp = F / ( g*mdt)
Comparison of the rates of change in mass ratio with Ariane5
Specific impulse is the parameter used to measure the efficiency of a rocket jet engine, and is basically the ratio of the useful jet impulse Ft (Ns) produced divided by the fuel flow-rate (mass per second in Kg/sec) required to produce that impulse .
Specific impulse
Isp is the index of performance for rocket engines and is defined by the following ratio : sec
sec
Where the numerator is the total impulse obtained over the operating time of the rocket engine. Usually referred to as the ‘Burn time’. Defined by the time period from t0 to t1.seconds.
Accompanied by a denominator which represents the total fuel mass flow necessary to produce the impulse during the same time period.
‘g’ is the acceleration due to gravity
gearth at sea level m/s2The above expression can be simplified to the ratio given below if the flow rate and thrust are constant over the burn time.
For liquid fueled rocket engines this is usually the case, so they can be represented by the ratio of the thrust force produced at the exit of the nozzle tearth divided by the product of gearth at sea level multiplied by the mass flow rate of fuel used to produce the thrust.
Specfic impulse
Isp
= ![]() sec
sec
...
Where
F is the Jet Thrust force at the outlet of the nozzle F = q * v2 N Newtons‘q’ is the volumetric flowrate * density r to give mass flowrate of fluid leaving the nozzle Kgs/sec
v2 is the exhaust jet velocity at the outlet of the nozzle m/sec
M
dt is the mass flowrate of fuelSo in the first instance it is possible to use this simplified ratio to model the water rocket.
To create an actual impulse and mass flow time history in the above integral ratio.
A more detailed model can be obtained by using the flight film data determine the mass flow with time, height, velocity and acceleration.
Sensitive accelerometers can be used to record flight data but the problem is the response time of the accelerometer immediately after launch.
Dimensional analysis of
Is AssumeIsp = ![]()
![]() Sec
Sec
Isp = 
 Sec
Sec
Tsiolkovski Impulse Function dimensional analysis
© All rights reserved by John Gwynn
The efficiency of the external and internal fluid dynamics of the projectile will have a significant affect the exhaust stream velocity and subsequently Is.
Specific Impulse is related to relative time t local with t earth and is also dependent on the local gravitational field glocal relative to external gearth
Whilst the normal levels of acceleration are experienced then standard Tsiolkovski and specific impulse formula apply.
But after a certain threshold of gravitational acceleration levels then both the Tsiolkovski formula and the specific impulse factor need to be modified.
Possible parameters that could improve Isp
-
An increase in thrust force for the same fuel mass flow rate.
Induced by an improved fluid flow regime either inside or outside the projectile.
Also combination of both
Note: The efficiency of the external and internal fluid dynamics of the projectile will have a significant affect the exhaust stream velocity and subsequently the value of Is.
So boundary layer disruption needs to be minimised to reduce drag. Flight dynamics need to be smooth and true to the intended flight trajectory to minimise this boundary seperation causing increased turbulence.
You can imagine the chaos set up in the boundary layer if the projectile has a twisting zig-zag flight pattern. Not to mention the disturbance to the internal fluid flow.
Remember that the boundary layer is like an invisible skin of molecules that covers the surface of the projectile. Where the boundary layer is stable and stays attached to the projectile then the flow adjacent will be lamina. We also need to minimise 'flutter' and vibration created by turbulent fluid flow
If we imagine that the external flow regime is stable then for the flow inside we need to optimise the massflow though the nozzle to produce the maximum impulse per kilogram of fuel.
In the case of a water rocket this would be equivalent to the mass flowrate of water in Kg/sec.
1. A change in the fluid flow parameters that would improve the fluid flow
efficiency per Joule of energy input to the system.
That means that physical characteristics like the critical Reynolds Number Recritical , q the
coefficient of heat transfer, Pr, Kn etc. changes as the state of the boundary layer changes.
This could involve changes in the boundary layer fluid properties.
Changes to the physical boundary layer properties that affect the coefficient of heat transfer, viscosity, Re, Pr, Ma, Kn, Altering the nature and make up of the fluid boundary film.
The Knudsen Number Kn relates the number of impacts encountered by a molecule as it travels along the length of the projectile. And is used to determine the relative fluid viscosity and the speed at which the fluid is capable of communicating changes in temperature and pressure.
In a compressible fluid the ratio of Mach No Ma to Knudsen Number Kn is important.
Kn is the ratio of the average free distance travelled by a molecule of fluid before it impacts with another and the characteristic length of the fluid flow L. Through which the fluid molecules exhibit a rapid relaxation by exchanging energy/ communicating at the speed of sound.
The viscosity of a perfect gas is proportional to the ratio Kn/Ma.
Compressibility of a fluid is directly related to the Mach No Ma.
For a compressible working fluid or gas. Where the value of Ma>1 is large the pressure waves propagate slowly but with a large amplitude.
Conversely for an incompressible fluid or gas. Where Ma < 0.25.Equivalent at sea level to 320/4= 80m/s. The velocity of the thermal heat transfer through the working fluid is faster than the fluid flow around the object. So pressure changes in the fluid flow external to the fluid boundary layer have little effect. A change in state of the fluid flow around a projectile is communicated faster by the intercommunications between molecules than can be transmitted by external fluid flow velocity.
For the application of perfect gas laws to be valid the value of Kn < 1/100.
2. A change in the density of the working fluid.
The external and internal fluid density
3. Modification to the relative time between tearth and t local.
Shift in relative time between tearth for the thrust impulse Ft mass flowrate Mdt t local..
This will depend on the degree of acceleration seen by the mass and how it influences the local gravitational field
Investigation
into the Relative Time fields with respect to Tsiolkovski mass
transfer ![]()
4. A modification to the local gravitational field to which the projectile is influenced.
glocal >>> gearth
If the gravitational field around the projectile was altered then items1, 2 and 3 would be all
affected.
Applied to compressed air over water 'Badoit' rockets at 8bar
This would not apply to all water rockets but to those with efficient high Isp conformity
a1 = 135.9g
a2 = 448.22g
Change in acceleration after tTsiol Da2 = a2 - a1 Da2 = 310g ( 3063m/s2 )
Remaining Impulse time Dit2 = t2 - t1 Dit2 = 0.0173 sec
Da2 / Dit2 = 17920g/sec
Ariane 4 2g/sec
Difference 8959 * A4 or 9.103
These light projectiles experience , for a fraction of a second, levels of acceleration greatly superior to those of normal space launchers like A4 or Ariane 5.
What happens when the projectile experiences a form of micro-gravity for a fraction of a second.
This raises the following possibility.
If at 135 glocal the gravitational field change caused a change in relative time t local.
Then we would expect to see a change in the value of Isp and an exponential increase in acceleration after the Tsiolkovski point TTsiol as seen in the acceleration curve produced from high speed film seen below.
......and the modified end function identified below could be a solution
Modified end function emg1/mg2
Original Tsiolkovski formula eM1/ M2
Dimensional Analysis
![]() it2
it2
Assumptions : ![]()
![]()
![]()
Were there a gravitational or relative time difference then this interface would occur at the exterior of the nozzle as the projectile fluid system meets the external world environmental parameters
PEarth, VEarth , gEarth, tEarth etc
![]() it2
it2
![]() a
a

e
If the local time changes relative
to ![]() then this will change the local
gravitational constant glocal.
then this will change the local
gravitational constant glocal.
Giving a dimensional parameter of the form 

![]() it2
it2
![]() =
=
For the rate of change of mass the
dimensions cancel ![]() = 1
= 1
e
As a comparison the rate of acceleration of a Badoit water rocket (although only over a fraction of a second) is of the order of more than 400 times that for the Ariane 4 Refer to Excel spreadsheet
© All rights reserved by John Gwynn April 2004 The Water Rocket Explorer
|
Table2 |
Bottle ‘A’ mf / Ts |
Bottle ‘B’ mf / Ts with nose |
|
5 |
105.8 |
158.22 |
|
6 |
145.14 |
197.37 |
|
7 |
163.3 |
222.25 |
|
8 |
192.31 |
259.66 |
|
Phase 1 |
||
|
Jet Thrust Force Fth |
305 N |
424 N |
|
Nett Specific Impulse Isp. With V 1 |
3.571 secs |
3.728 secs |
|
Phase 2 with Tsiolkovski effect Assuming the Tsiolkovski hypothesis we would expect to see |
||
|
Jet Thrust Force 2 Fth |
705 N |
1075 N |
|
V2 Isp 2 Tsiol factor |
8.62 secs |
9.654 secs |
|
John.Gwynn |
Note :Our rockets seem to kick in to a higher gear at about 6.5>7 bar. The
mf / Ts equivalence would appear to be at the upper limit of the trial launches carried out
Rocket launch of bottle 'B' 1000ml
|
Velocity Calculated from area under Acceleration time curve at 8 bar |
|
|
1st Stage WR ‘B’ 1000ml Blunt Projectile |
V 92.1m/s |
|
Maximum acceleration of projectile B Limited by height of image recorded h=2.4m |
4397 m/s2 |
| Tsiol Ts Point for B 8bar | 0.0467 s |
| Tsiol B mf / Ts | 202.43 |
| Tjet |
0.068s |
| Tsiol B mf / (Ts*Ne) | 4265 |
|
1st Stage WR ‘A’ 2145ml Hemi-spherical nose |
V 88.9 m/s |
|
Maximum acceleration of projectile A Limited by height of image recorded h=2.4m |
3161.2 m/s2 |
| Tsiol Ts Point for A 8bar | 0.047 s |
| Tsiol A mf / Ts | 192.31 |
| Tjet |
0.0675s |
|
John Gwynn © 7.04.2004 |
Note: Because of the different volumes of bottles used the forcing compressed air spring energy is not the same for both bottles. So the reservoir of J/s available to do work on the fluid will not be the same.
Refer to launch images and video with 10m frame height.
The following images where recorded at 500frames per second. 0.002secs per image for the 2.145L bottle.2003
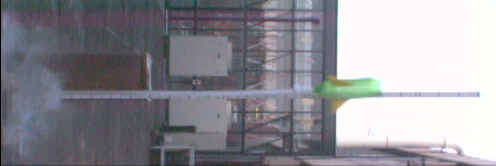 Image73
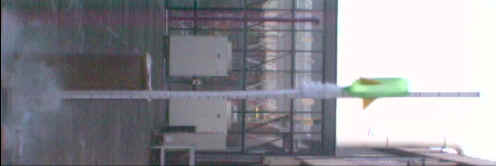 image72
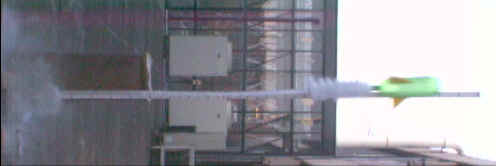 image71
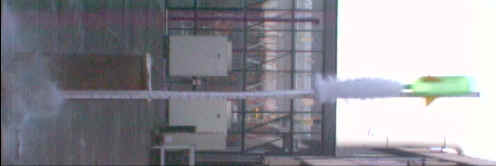 image70
From analysis of the images above a combine dynamic rocket pulse frequency of approximately 1500c/s. can be seen. That is produced by the combination of the external rocket flight aerodynamic flow and that of the fluid flow through the nozzle.
Interestingly the spray plume seems to be symmetrical in form with that of the bottle.
The plume signature produced could be caused by:
-
Alternative compression expansion waves as the pressure leaving the nozzle collapses back to atmospheric.
-
Axial Chugging frequency in the bottle as the fluid is driven out.
-
External pressure fluctuations due to the separation of the external aerodynamic flow regime of the rocket.
-
A combination of the above.
These multiple pulses are not seen in the jet wake signature of the Badoit bottle.
The force input to the system can be represented by imagining a forcing step pressure impulse to the system ht producing a variably damped response function of the type:
( 1/C )* e - Kt/C.
.The damping function provided by the gas charge density left in the bottle will decrease with time. Whilst the generation of turbulent fluid flow and mixed fluid flow will encourage an increasing or cyclic damping effect.
High energy liquid fracture
Materials and fluids behave differently under high energy impact conditions.
So what could happen to a high energy water jet?

Featured above is a photograph featured in Pour La Science ( Physics review letters 17 Dec2004)
The image on the left show a low energy water jet impacting a bath of water. The water jet impinging and deforming the surface
Whilst the image on the right shows a high energy water jet impacting the surface and entraining a very thin layer of air like a skin trapped at the interface between the jet cord and the static water of the bath . Forming a sought of trumpet that becomes unstable at its extremity where it begins to break up or fracture.
Why does it decay or dissipate its energy in this fashion.?
Fluid flow dynamics
Bernoulli flow equation compares the energy distribution within a fluid flow system. By generating fluid pressure equivalents for dynamic pressure 1/2rv2 due to the fluid flow velocity, potential pressure rgh, due to the hydraulic head and static pressure P forcing the fluid flow. .r
![]()
http://scienceworld.wolfram.com/physics/BernoullisLaw.html
Understanding The Gravitational attraction force between two masses.
Note: Keep in mind that the Earth has a mean velocity of 29.78 Km/sec around our sun and depending on what you take as a reference point in the universe. Our solar system will have a relative motion within our galaxy ( say about its centre) and our galaxy will have a relative motion to some reference point in the universe.
http://www.fourmilab.ch/gravitation/
The Scientist Cold Play
15/11/07
This site was created on the 15th April 2003
©John Gwynn and sons2003
You're welcome to reproduce any material on this site for educational or other non commercial purposes
as long as you give us proper credit (by referring to "The Water-Rocket Explorer" http://waterocket.explorer.free.fr).