
This site was created on the 15th April 2003
Shadow Graph of a bullet.
Boundary Layer Formation
| The following is intended as an introduction
to aerodynamics. Introducing the concept of boundary layer fluid flow
and explains the parameters of Reynolds number (Re), Mach number (Mach)
and Knudsen number (Kn).
Course time 30mins. |
||||||||||||||||
| All projectiles moving through a reservoir of gas or liquid create a fluid boundary film between the surface of the projectile and the free flowing fluid through which it travels. | ||||||||||||||||
 |
Depending on the velocity of the projectile this boundary film of gas or liquid will form an invisible skin over the surface of the moving object. Whose thickness, stability and velocity will be determined by the profile shape or form of the projectile and the quality of its surface. Certain form shapes allow this boundary layer to form a skin over their entire surface which remains stable until either an external force or a threshold velocity is reached when this boundary layer begins to separate from the projectile surface The turbulence created by this separation increases the velocity of the boundary layer with a consequential drop in pressure. This pressure drop effectively tries to hold the projectile back and increases the aerodynamic drag force that resists the forward motion of the vehicle. | |||||||||||||||
|
Usually this boundary film is very thin and both its properties and stability are difficult to analyse. |
||||||||||||||||
|
If we take air as the medium through which the projectile moves then we can imagine that it is made up from a mixture of gases and will contain a varying amount of moisture. Its density will also vary with height, temperature and pressure. |
|||||||||||||||
 |
This thin skin of fluid attached to the projectile, is referred to as the boundary layer. Its thickness will increase along the projectile length until a point is reached when it detaches from the surface and creates turbulent swirl or rolling wave motion within the fluid flow. That is also accompanied by a fluctuation in pressure. At higher velocities this 'Karman' turbulent swirl or wake is the cause of vibrationary flutter in light low stiffness structures. Avoiding and controlling this flutter is very important for aircraft and rocket structures. Where optimum structure weight is an important design objective.
One method of determining when this transition occurs between lamina and turbulent flow regimes is to find the value of the Reynolds number at this transition point. That compares the fluid density and viscosity with changes in the fluid flow velocity and the characteristic length or dimension of the surface over which it flows.This is usually achieved by testing small scale volumetric models of the projectile. To discover the Re No. and the Cd aerodynamic drag coefficient associated with the fluid flow regime. We do not need to this for most common shapes and form of projectile since there is a considerable amount of basic research and test data already available.
|
|||||||||||||||
|
A classical visual presentation of viscous fluid boundary layers. |
||||||||||||||||
 <Click <Click |
||||||||||||||||
|
| ||||||||||||||||
| Reynolds Number | ||||||||||||||||
|
Where r = Density of the fluid. Kgs./m3 V = Velocity of the fluid flow m/s L = Characteristic length of an object exposed to the fluid flow. m m = Dynamic viscosity of the fluid. N.s/m2
Discovered in 1883
Osborne Reynolds (1842-1912) Engineer and physicist professor of Physics at Manchester University
|
To understand what happens when a fluid
flows around an object we can use various dimension-less parameters
to determine the quality of fluid flow.
The most famous of which is the Reynolds Number Re. Using Re we can identify fluid flow thresholds for specific projectiles that indicate when the fluid flow changes from a stable lamina flow to that of a turbulent unstable flow regime. This is known as the Critical Reynolds number Rc There is a critical Rc for all different form shapes and volumes. For example the form shape for a car passing through air is known to be in the region of 2*105. Beyond which the fluid flow will be more prone to separate from the surface and become disturbed or turbulent in nature. The profile detail of the first 300mm for a car is critical in determining the static pressure in front of the car and the point at which boundary layer separation will occur. For fluid flow over a horizontal flat plate the transition occurs at Rec = 5*105
| |||||||||||||||
|
Re = V L n
n = Kinematic viscosity of the fluid. m2/s
n = m r
|
Looking at the Reynolds equation1 we
can see that the Re number will increase with fluid flow velocity, fluid
density and the characteristic length of the projectile.
Re will decrease with an increase in the viscosity of the fluid. Another way of expressing Re is to use the value of n the Kinematic viscosity of the fluid. From which we can see that the same value of Re is achieved with an air flow velocity 14.75 greater than water flowing over the same unit length obstacle. So a projectile traveling through water will have a maximum velocity that is considerably slower than if it was passing through air. If you then take a bath of treacle and try to get your projectile to fly through it, we can calculate the velocity we would expect. Providing we can find the value for n for the fluid in this case treacle. And we can identify the Rc for the projectile. What you will find is that the critical Re number is reached very quickly at a very low velocity. Logically this is no big suprise. The smaller the value of kinematic viscosity n for the fluid the lower the value of velocity V required to reach the critical Reynolds Number. Rc remember is a constant for each type of object or projectile.
Spreadsheet with comparison. Comparison of Re and Cd associated with different form shapes.
So for our rocket what we need to find is: The critical Reynolds number for the rocket shape Rc. and an accurate velocity time history of the flight. Then the value of n for the atmosphere in which it will fly. A table of some values of Reynolds number calculated for basic bottles at measured velocities.
| |||||||||||||||
Comparison of nair/nwater at
different temperatures.
|
The value of Kinematic viscosity n must be related to the
properties of:
m = Dynamic viscosity of the fluid. N.s/m2 and r = Density of the fluid. Kgs./m3
for a fluid flowing around a projectile at the specific operating temperature being analysed. This is illustrated by the table comparing the variation of the ratio nair/nwater.
As a general rule. Dynamic viscosity m decreases with increasing temperature for fluids but the value of m increases for gases.
Try to have a full table of properties of fluids and gases over a range of temperatures at hand when modelling the problem. | |||||||||||||||
|
The history of the first wind tunnel
http://www.grc.nasa.gov/WWW/K-12/WindTunnel/history.html
| ||||||||||||||||
|
| ||||||||||||||||
 |
Some everyday examples of fluid boundary film effects.
OK so our car needs a clean. But look a little closer. How do you explain why the mud lifted up by the front wheel fails to cover all the lower side panel. | |||||||||||||||
|
A little clue is that the rear door edge stands about 4mm above the surface of the main body side.
| ||||||||||||||||
 |
The air vortex generated by the turning
front wheel blows out from the wheel-arch and mixes with the side air
stream flowing along the side of the car. Since the car is moving forwards
the air is displaced and moves around the car flowing from front to
back.
Mud particles flung up by the tyre get mixed up in this air flow and are deposited on the side of the car. So why is no mud deposited rewards of the door? One way of de-stablising the fluid boundary layer attached to the surface of the car is to introduce a sudden change in profile. For minor changes in profile this property can be used to extend the overall length of the projectile to which the fluid boundary film stays attached. By gently tripping the boundary layer into a local separation that then reattaches to the surface a little further along the length of the projectile body. This can be achieved by placing tape strips across a surface at 900 to the direction of fluid flow. A deliberate change in profile by introducing a clean cut panel edge or a deliberate low rib feature has the same effect. Sometimes this trick is used to avoid a larger more violent flow separation occurring further down the fluid flow field that would dramatically increases aerodynamic drag. If it was allowed to develop. Another reason for boundary layer separation is that there is a none uniformity of surface finish or roughness.
Now in the case of the photograph. What we can say is that the vertical rear edge of the door panel has acted as a fluid boundary layer trip. With the separated air stream transporting all the mud particles.
There could be a reattachment to the surface at the front edge of the rear wheel spat. All this is assuming that the velocity of the projectile is constant. But of course this is not the case. Our little run about car probably averages 60Km/hr locally. Which resulted in this mud deposit over several weeks. So it is representative for this type of average road speed. However if we where to use the same car on the autoroute / motorway everyday then the average velocity would be higher and the airflow over the car would be modified. With the separation and re-attachment points being modified. The distance from the front of the vehicle at which the transition within the boundary layer takes place will alter. Usually the higher the projectile speed the further forward this detachment occurs.
Another variable is the quality of speed transition or change in velocity of the fluid flow. You can imagine that if the driver of the car drives smoothly then the air flow transition will be smooth. As velocity increases. Conversely if the driver is a learner and makes the car jump around whilst changing gear, accelerating and braking. Then this will degrade the smooth air flow transition.
So next time you wash the car take a good look first and see if you can spot any signs of flow separation.
| |||||||||||||||
|
The non linear velocity and acceleration recorded during water rocket launch means that a constant velocity model will not adequately represent what is happening within the fluid boundary layer. During the water jet impulse. Any jet pulsing surges and sudden deviations in flight trajectory will also disturb the stability of this boundary film. Increasing the turbulent nature of the air flowing around the rocket.
| ||||||||||||||||
|
| ||||||||||||||||
|
| ||||||||||||||||
|
|
||||||||||||||||
| Mach Number | ||||||||||||||||
|
All standard aerodynamic theory assumes a constant velocity air flow model and an incompressible working fluid.
|
For most objects we encounter in our everyday life the assumption of a perfect gas and incompressibility of the working fluid can be assumed to be a good approximation. | |||||||||||||||

Original shadow graph of a supersonic bullet photographed by Ernst Mach 1887. Shadow graphs are similar to Schlieren photographs which are also used to identify changes in densiy Here you can clearly identify the strong compressive bow wave at the head of the bullet and a a secondary < wave at the tail followed by a turbulent wake. Ma = V2 / Vsound
Where V2 Is the velocity of the projectile m/s Vsound Velocity of sound m/s
|
So for projectiles like humans running, riding a bicycle and the family car this is adequate. However for high accelerations and high flow rates the boundary film begins to behave as a dynamic gas or fluid. That absorbs and transmits energy as it is compressed and heated. This form of energy transmission within the boundary film from one packet of molecules to another. Was first identified in1887 by Ersnt Mach (1838-1916). Where he recognised that energy is transmitted within the fluid at the velocity of sound. This relaxation between molecules or rapid energy transfer is one of the principle parameters that control the fluid film stability. Where Vsound is adjusted for the temperature and density of the surrounding fluid. At sea level and 200C Vs = 340 m/s. As the density of the atmosphere changes the velocity of sound will also change.
When a projectile reaches the speed of sound. The compressive shock waves created in the air flow and the changes in boundary layer air temperature can be recorded in a shadow graph. This is because the light passing through the volume of air surrounding the projectile is bent or refracted. Due to the changes in air density and temperature resulting from the shock wave Note: The above image is not a flat 'V' shape but in fact a transparent cone.
In 1929 The Mach Number was officially recognised as an international standard and is the ratio of V2 / Vsound. Ersnt Mach is recognised as being the first to identify and explain supersonic flight aerodynamics and its relation to the velocity of sound. | |||||||||||||||
|
As the ratio of M = V2 / Vsound reaches values of 1or greater then M-1 = Vsound / V2 = Sin a Where V2 Is the velocity of the projectile m/s Vsound Velocity of sound m/s
2 a = 2* Sin-1( Vsound / V2 ) Is the included angle of the working fluid or (gas) cone. This is the leading cone angle formed between the envelope of compressed gas produced by the shock wave. Effectively this means that the higher the Mach number the smaller the cone angle produced.
So if you want a challenge have a go at working out the velocity of the bullet featured in the photograph at the head of this page. Remember you have the table of cone angles to help you.
| ||||||||||||||||
| Variations in fluid flow | ||||||||||||||||
| M < 0.3 |
Working fluid is treated as incompressible The thickness of the boundary layer d reduces with increasing velocity The thickness also increases with increasing length along the projectile body. .d a x / Re 0.5
Re = rV L m
Re = V L n
| |||||||||||||||
|
| ||||||||||||||||
| M < 1 | Defined as the subsonic region. Where the fluid is treated as a perfect working fluid and the equations of movement are elliptic in nature. | |||||||||||||||
|
| ||||||||||||||||
| M = 1 | Transitionary domain where the fluid motion type is
mixed and complex.
| |||||||||||||||
|
| ||||||||||||||||
| M > 1 |
Supersonic region. characterised by the creation of shock waves. Fluid motion is now defined by hyperbolic equations.
| |||||||||||||||
|
Compressible fluid regime. In high fluid flow regions with velocity V greater than or equal to M. The fluid boundary layer begins to increase in thickness due to an increase in temperature. Which is caused by increasing friction and viscous effects within the fluid boundary layer. The fluid is now compressible and as it becomes heated the fluid expands and its density reduces . The rate of heating is related to the Knudsen No Kn and its relative value to M. The fluid boundary film thickness d d a M2/ Re 0.5
Re = rV L m
Re = V L n | ||||||||||||||||
|
| ||||||||||||||||
| M >> 1 | Hypersonic region which requires the integration of
thermodynamic, molecular and chemical interaction within the fluid
.
| |||||||||||||||
|
Note : Our water rockets function at Mach values between M = 0.3 and M > 0.3 So the fluid flow region falls at the transition between the lower two groups and is consequently affected by the transition from incompressible to compressible working fluid during the water jet impulse. Consequently it is important to understand that the use of properties for the working fluid exterior and interior will not necessarily behave as ideal gases or fluids. John Gwynn. | ||||||||||||||||
|
Nova history of the development of supersonic aircraft http://www.pbs.org/wgbh/nova/barrier/history.html
| ||||||||||||||||
|
The Shape of projectiles and flight efficiency
| ||||||||||||||||
|
Courtesy Fluent Europe. | ||||||||||||||||
|
Here you can see the static pressure profile produced by the transonic air flow over an aerofoil section. Red indicates high pressure whilst the dark blue indicates low pressure The difference in pressure above and below the wing profile creates lift. | ||||||||||||||||
|
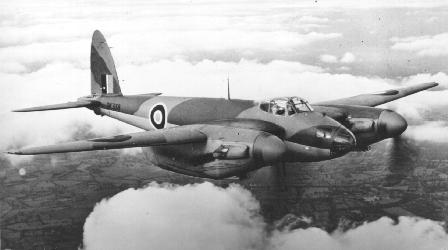
B2 fuselage profile. Interestingly some of the smoothest projectiles for fluid flow efficiency are The WW2 De Havilland Mosquito and the USAF B2. Both have an elongated tear-drop side profile and a L/D fuselage ratio of 6:1
Courtesy The Aviation History On-Line Museum.
| ||||||||||||||||
| Nature seems to be far more efficient:
Our current level of understanding seems to be basic when we compare this with nature. Here are a couple of photographs I took of some Red Kites flying over a hay field in St Baudiere looking for dinner. Now that's what I call flying. Completely integrated with nature
| ||||||||||||||||
|
| ||||||||||||||||

| ||||||||||||||||

Yes you guessed the main body length to width ratio 6:1
| ||||||||||||||||
|
Swfts have been found to use wing Morphing to reduce the energy required for flight.
The secret is their ability to change the shape of their wings so that they get the best performance for the smallest amount of energy - scientists call it "wing morphing".
Article in Nature
25th April 2007 | ||||||||||||||||
|
| ||||||||||||||||
| Comparison of fluid boundary layer dynamics of three types of projectile. | ||||||||||||||||
|
| ||||||||||||||||
| 1.A Fly Very slow flight velocity
| ||||||||||||||||

| ||||||||||||||||
|
The common fly is an good example of a very slow flying object. Vfly = 0.2 m/sec Length LF ly = 0. 01m Air density r = 1.226 Kg/m3 Assumed Average free distance travelled by an air molecule before impacting another Lfree= 1 *10-6m Description of the boundary layer: Due to the slow velocity of the fly 0.2 m/sec . Air molecules passing along its surface will take a long time to cover the length of the its body. Basically what this means is that the longer the time it takes for a molecule of air to pass over the surface of the fly the more it will be exposed to impacts with other air molecules. So effectively from the flies view point the air molecules will appear to be more tightly packed and viscous. Flying through air for a fly will therefore be equivalent to swimming through water for humans. This makes the adoption of a hydrodynamic model justified. When we are modeling the boundary layer of a slow moving object like a fly.
If we calculate the number Lfree* Vfly / LF ly = 0.2*10-4 This indicates the relative exposure of an air molecule to impacts during its voyage along the surface length of the fly. Therefore impact exposure Iexp is proportional to 0.2*10-4. Ifexp a 0.2*10-4. The relative impact exposure of a fly compared to the space shuttle can be approximated by dividing Ifexpby the equivalent value found for the space shuttle.
Relative Iexp = 0.2*10-4/0.0012*10-4 =166.7
Fn/Ma = 3.401* 10-2
| ||||||||||||||||
|
| ||||||||||||||||
| 2.Subsonic Passenger Jet aircraft
A380 | ||||||||||||||||
|
Velocity M 0.7 Vjet= 222m/s LPjet = 100m Air density r = 1.226 Kg/m3 Lfree= 1 *10-6m Lfree* Vjet / LPjet = 2.22*10-6 = 0.022*10-4 IJexp a 0.022*10-4 Relative Iexp = 0.022*10-4/ 0.0012*10-4 =18.33 Fn/Ma= 3.37*10-4 At subsonic velocity the free air stream transports air molecules along the length of the aircraft structure. Within the lower atmosphere an air molecule will impact another after an average 'free distance' of every micro meter. Every 1*10-6m. With such a high frequency of impacts occurring within the fluid boundary layer. Thermodynamic equilibrium is quickly established and an incompressible viscous fluid can be adopted as the hydrodynamic model.
| ||||||||||||||||
|
| ||||||||||||||||
|
3.Hypersonic Space shuttle at re-entry
| ||||||||||||||||
|
Re-entry velocity M18 VSh =~ 6210m/s LSh = 60m Air density 30 kms altitude r = 0.02Kg/m3 Lfree= 1 *10-8m Lfree* VSh / LSh = 0.0012*10-4 IShexp a 0.0012*10-4 Let relative Iexp =1 Fn/Ma= 6.67*10-9 At supersonic speeds the fluid boundary layer behaves as a compressible gas or fluid. In the very low density of the outer atmosphere, air molecules will slide along the surface of the shuttle in a fraction of a second. Due to the very low density of air at this altitude. The free distance travelled by a molecule of air before it impacts another will be very long. So inspite of the very high velocity the air molecule will receive very few impacts. As a consequence the boundary layer will have a very low viscosity or none viscous nature. Here the use of a hydrodynamic model is not justified and cinematic equations based on the Boltzmann distribution of molecules within the fluid/gas is used. This reduces the boundary layer into packets of molecules and predicts the proportion of the fluid molecules with similar properties like velocity and direction. In a compressible fluid the ratio of Mach No Ma to Knudsen Number Kn is important. Kn is the ratio of the average free distance travelled by a molecule of fluid before it impacts with another and the characteristic length of the fluid flow L. Through which the fluid molecules exhibit a rapid relaxation by exchanging energy/ communicating at the speed of sound.
Our ratio of Lfree/ Lprojectile used above approximates the value of Kn. But assumes that the fluid boundary layer stays attached to the projectile and that the inter molecular relaxation occurs along its full length. Obviously the length along any projectile for which the boundary layers stays attached will be determined by its aerodynamic profile and surface quality. The system that produces the lowest number of pressure disturbances along its surface will encourage the boundary layer to stay attached. In the real world the longer the projectile is above the ration of L/D =6 the more likely you are to get boundary layer separation. An example of this is the Saturn V rocket used to launch the moon missions. If we where to develop a new moon rocket it would be much shorter and made up from accelerator modules that could be quickly used and ejected.
Comparison of our three types of flying object leads to the following conclusions. The relative impact index between the three cases demonstrates the importance of knowing the value of Kn. for each fluid flow case. Where we can see that a molecule of air passing over a fly receives 167 more impacts/sec than if it was in the thin outer atmosphere passing over the surface of the space shuttle. Which explains why air seems more viscous to a fly than for a passenger jet or the space shuttle
| ||||||||||||||||
|
| ||||||||||||||||
|
| ||||||||||||||||
|
4.Now calculating the same parameters for our water rocket : Velocity M 0.32 Vwr= 110m/s Lwrb = 0.475m Air density r = 1.226 Kg/m3 Lfree= 1 *10-6m Lfree* Vwrb / Lwrb= 2.3159*10-4 Iwrexp a 2.3159*10-4 Relative Impact exposure Iexp = 2.3159*10-4/ 0.0012*10-4 =1929 Fn/Ma = 7.72 *10-4
| ||||||||||||||||
|
| ||||||||||||||||
|
Fluid flow viscosity comparison. | ||||||||||||||||
| ||||||||||||||||
|
| ||||||||||||||||
|
The viscosity of a perfect gas is proportional to the ratio Kn/Ma.
Compressibility of a fluid is directly related to the Mach No Ma.
For a compressible working fluid or gas. Where the value of Ma>1 is large the pressure waves propagate slowly but with a large amplitude. Conversely for an incompressible fluid or gas. Where Ma < 0.25. The velocity of the thermal heat transfer through the working fluid is faster than the fluid flow around the object. So pressure changes in the fluid flow external to the fluid boundary layer have little effect. A change in state of the fluid flow around a projectile is communicated faster by the intercommunications between molecules than can be transmitted by external fluid flow velocity.
For the application of perfect gas laws to be valid, the real value of Kn < 1/100. Must be less than 0.01 Martin Knudsen (1871–1949). Swedish physicist Kn is the ratio of the free mean molecular path length divided by the characteristic length of the surface or body it flows across.
| ||||||||||||||||
| If you have managed to get
this far. Well done.
Today there is sophisticated aerodynamic software available. That can model fluid flow fields around flying objects like flies, planes and rockets. So most of the parameters mentioned above are included in the model to indicate when there is a transition point in the fluid flow surrounding the flying object. As the models become more accurate to the real flying object they require a considerable amount of computing time (CPT) to achieve the number crunching. Here is an example of a model of a fly. The first shows a full flight simulation and illustrates how vortices are shed from the wing surface. The model was generated by analysing the sequence of images recorded by a high speed film of a fly flying in a wind tunnel. Whilst the second models the wing motion that creates these fluid flow disturbances in the air passing over the fly. Courtesy Fluent Europe. | ||||||||||||||||
 | ||||||||||||||||
|
| ||||||||||||||||
 | ||||||||||||||||
| Pdf file of text describing the fly model project. | ||||||||||||||||
|
Examining this shadow graph of a supersonic bullet we can identify several important characteristics. 1.The leading acoustic bow shock wave is formed by the tip of the bullet compressing the fluid ( in this case air) through which it travels at a velocity greater than sound. The form of the curve of this shock wave at the tip of the bullet is determined by the physical cone shape of the bullet tip. Note: That the shadow-graph image is a record of transmitted light that has passed through the transparent air cone created by the bullet .
2.Compression shock waves Due to the blunt form of this bullet several secondary compression waves can be seen further along the length of the bullet profile. As the cross sectional area of the projectile increases from the tip towards the main body diameter a volume of air is displaced and compressed. If there are any irregular surface changes to the smooth profile these will act as points from which the secondary compression's will occur. Each compression will require an equivalent expansion for equilibrium to be restored. A second principle compression shock wave can be seen trailing from the rear of the projectile. Two principle shock waves are characteristic of a projectile in supersonic flight. So if you observe and listen to a supersonic plane you will hear a double boom in rapid succession. Making a Ba -boom.
3.Expansion waves. Conversely when the projectile body reduces in cross section expansion takes place. As a volume of compressed air close to the surface is allowed to expand into the new volume created. Expansion waves cause the fluid flow to fan out. Expansion fans can be seen near the rear corner of the bullet profile.
4. Turbulent 'Karman' Wake. When the section of the bullet suddenly terminates in a square cut off at the rear (left side) of the profile. The controlled fluid flow over the surface of the bullet is suddenly tripped into a turbulent swirl and momentarily creates a sharp drop in pressure as the air flow velocity increases and then tries to suddenly return back to the surrounding pressure. The swirling flow of the wake will eventually recover after a series of compression and expansion phases and merge with the stable surrounding air flow . The phased pulse seen in this wake is due to the fluid in the wake progressively returning back to the energy state of normal surrounding fluid flow through a series of after shocks. Note: Close observation of the swirl produced in the wake indicates that there is some fractal nature to the small. turbulent swirls seen immediately behind the bullet and the progressive enlargement of the swirls developed later in the flow field. So one of the main objectives when designing the form of a projectile. Is to choose a profile with a surface that produces minimum fluid turbulence for the range of velocities through which the projectile is expected to fly. Optimum efficiency is obtained when there is smooth fluid flow and the minimum of turbulence.
Note: Aerodynamic fluid flow applies to the flight of projectiles within the atmosphere where there is a fluid. As a projectile like a space rocket passes above the Earth's thin atmosphere the atmospheric fluid drag forces progressively reduce as the density of the atmosphere reduces with height until at 40 kms where effectively the atmosphere ends and the near vacuum of space begins.
Note: Karman was one of a group of famous Hungarian astro-phycists defining some of the early principles involved in aerodynamics and a founding member of what would later become the JET propulsion laboratory.
| ||||||||||||||||
|
| ||||||||||||||||
|
Useful introduction to Aerodynamic compressible fluid flow regimes. NASA Guide to compressible aerodynamic flow for undergraduates. http://www.grc.nasa.gov/WWW/K-12/airplane/shortc.html
| ||||||||||||||||
| Anderson : The History of Aerodynamic
Rocket planesMach1 , Vostock1 Gagarin Mach 25.
| ||||||||||||||||
 | ||||||||||||||||
| So how can we apply this to water rockets. | ||||||||||||||||
|
First we need to know what the value of the aerodynamic drag coefficient for the rocket is. This can be worked out by measuring the drag force created by a scale model of the rocket . Suspended in a stable air flow of known velocity. This requires access to a calibrated wind tunnel. We can use Reynolds Number Re to predict the performance of the rocket at higher airflow velocities than can be generated by the wind tunnel. By producing a smaller scale model of the rocket.
Re = rV L 1 m
Calculating Reynolds number for several bottle types
Then using the drag force value substituted into the formula to determine the value of the aerodynamic drag coefficient Cd.
Fd = 0,5(de)(Cd)A(V2+Vair) 2 N
Rearranging this formula we can find the value of Cd.
Cd = 2(Fd ) (de)A(V2+Vair) 2 Calculating the aerodynamic drag force for a projectile
What difference does the nose cone shape have on the performance of a rocket. What difference does the nose cone shape and the value of the aerodynamic drag coefficient Cd have on the maximum altitude achieved by a rocket. Nose cone shape needs to be selected for the specific range of flight velocities which the rocket will experience.
So initially this is approximated and then flight data logging helps to quantify the performance of the rocket. Subsequently the nose cone shape which can guarantee maximum efficiency throughout the flight can be identified. Water rockets are subsonic which encourages the selection of a parabola shaped nose cone. In this back to back comparison the parabola shaped nose cone can be shown to give a 25% improvement compared with a blunt or 'bluff' nosed rocket. Here a range of standard shape nose cones have been tested on a standard model solid fuel rocket. http://www.aerospaceweb.org/question/aerodynamics/q0151.shtml Best book on aerodynamics 'Fundamentals of Aerodynamics', J.D Anderson Jr. McGrawhill.
I recommend a visit to this site for an interesting source for information on flight aerodynamics. www.aerospaceweb.org/question/aerodynamics/q0074.shtml
What are fractals? An introduction to fractals and fractal types. http://math.rice.edu/~lanius/frac/
| ||||||||||||||||
|
Link to sound track and video of Cold Play 'Speed of Sound' http://www.virgin.net/music/musicvideos/coldplay_speedofsound_hi.html
Fundamental Aerodynamics J D Anderson< Click Important reference reading Fluid Mechanics Introduction to flight J D Anderson Accompanying music http://www.youtube.com/watch?v=c9j_RZDqYc4&feature=related
| ||||||||||||||||
This site was created on the 15th April 2003
©John Gwynn and sons2003
You're welcome to reproduce any material on this site for educational or other non commercial purposes
as long as you give us proper credit (by referring to "The Water-Rocket Explorer" http://waterocket.explorer.free.fr).


 A Rush of Blood to the Head